Core Technical Indicators for Spotting Volatility
Volatility—the speed and magnitude of price movement—isn’t random chaos. It leaves footprints. The key is knowing which indicators highlight tremors before the quake.
Bollinger Bands: The Squeeze vs. The Expansion
Bollinger Bands plot a moving average with upper and lower bands based on standard deviation (a measure of dispersion around the average).
When bands contract tightly—known as “the squeeze”—it signals low volatility. Historically, low volatility periods often precede sharp price moves (Bollinger, 2001). Think of it like a coiled spring.
When bands expand, volatility is already surging.
Squeeze vs. Expansion:
- Squeeze: Calm before the storm
- Expansion: Storm in progress
(If markets had a “quiet before the jump scare” soundtrack, this would be it.)
Average True Range (ATR): Measuring the “Noise”
ATR calculates the average range between high and low prices over a set period (Wilder, 1978). Unlike Bollinger Bands, it doesn’t predict direction—just intensity.
- Rising ATR: Increasing volatility
- Falling ATR: Contracting movement
Bollinger Bands vs. ATR:
Bollinger hints at breakout setups; ATR quantifies how wild price swings actually are.
Pro tip: Many traders set stop-loss distances at 1.5x–2x ATR to avoid being shaken out by normal market noise.
The CBOE Volatility Index (VIX): The “Fear Gauge”
The VIX measures expected 30-day volatility derived from S&P 500 options pricing (CBOE). It typically moves inversely to the S&P 500.
- Market drops → VIX rises
- Market rallies → VIX falls
Here’s a side-by-side view:
| Indicator | What It Measures | Best Use Case |
|————|——————|—————|
| Bollinger Bands | Price deviation | Breakout spotting |
| ATR | Avg. price range | Stop placement |
| VIX | Expected volatility | Market sentiment |
Some argue the VIX is less relevant outside U.S. equities. Fair. But global markets often mirror U.S. volatility shocks (see 2008, 2020).
Keltner Channels: A Smoother Alternative
Keltner Channels resemble Bollinger Bands but use ATR for band width instead of standard deviation.
In trending markets, Keltner Channels often produce cleaner signals. In ranging markets, Bollinger Bands may react faster.
That’s why traders combine them within high volatility trading indicators frameworks—confirmation beats guesswork (most of the time).
Understanding when to use each tool is the edge.
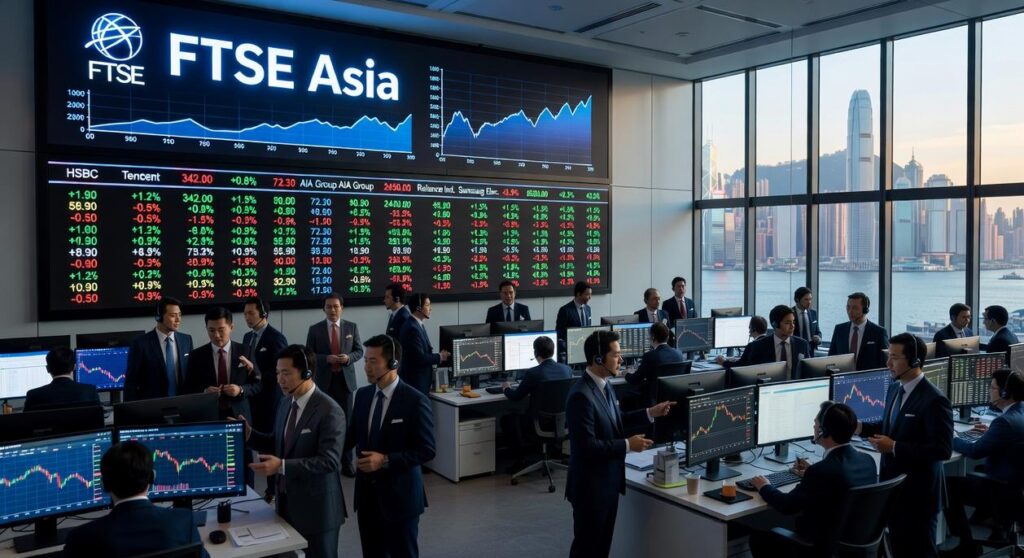
Practical Application: Reading Volatility in Asian Indices
Imagine the Nikkei 225 trading in a tight range ahead of a Bank of Japan announcement. Price compresses inside a Bollinger Band squeeze (when the bands narrow, signaling reduced volatility), while the Average True Range (ATR)—a measure of average price movement—hits a monthly low. This convergence often precedes expansion. Markets don’t stay quiet forever (they whisper before they shout).
Some traders argue announcements are coin flips. Fair. Headlines can trigger false breakouts. But when compression, low ATR, and a macro catalyst align, probabilities shift. You’re not predicting direction—you’re preparing for movement.
Actionably, traders may:
- Set breakout orders above resistance and below support
- Tighten stop-loss levels to control downside
- Reduce position size pre-announcement
For futures traders, this matters even more. Leverage amplifies both gains and losses, making high volatility trading indicators essential for risk planning. Pro tip: monitor volume alongside volatility for confirmation.
Trade with Foresight, Not Fear
You came here to learn how to spot volatility before it catches you off guard. Now you have a practical toolkit to do exactly that.
Trading blind to market swings is a fast track to unnecessary losses. Without the right signals, high volatility feels random and overwhelming. But it doesn’t have to be.
By combining ATR, Bollinger Bands, and close monitoring of economic events, you shift from reacting emotionally to anticipating strategically. These high volatility trading indicators give you structure, clarity, and timing when markets turn turbulent.
Now take action. Add one or two of these indicators to your charts today. Watch how they behave during major news releases. Build your skill with real observation.
Don’t let volatility control your trades. Use proven tools, sharpen your edge, and start trading with confidence today.